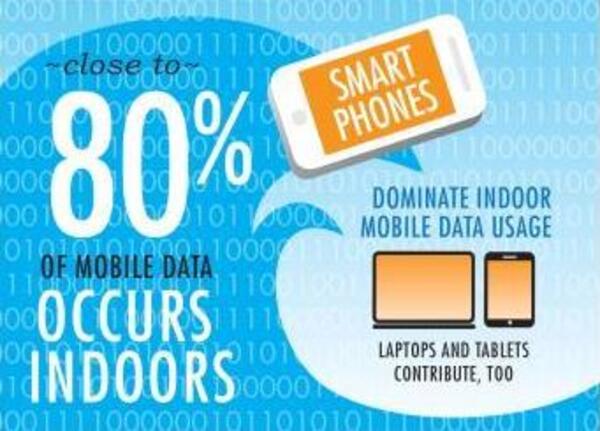
Supporting wireless services inside buildings is not new. Operators have been dealing with the challenges of wireless coverage in areas where concrete walls and glass bock RF signals for years. But in-building wireless today is more about providing capacity than just ensuring reliable coverage. Why? Foremost, it’s due to smartphones and the easier accessibility to data-intensive applications that people use them for. When 80 percent of mobile sessions occur indoors, it’s easy to see why providing more in-building wireless capacity is a concern.
The Data Tsunami Indoors touches on some of the other drivers, too. According to our calculations, only two percent of commercial real estate globally has a dedicated in-building wireless system. And yet this year, 90 percent of companies will support their corporate business applications on employees’ personal mobile devices. Bring Your Own Device (BYOD), as this trend is commonly called, means a wider variety of devices and operator networks that need support.
Many wireless industry analysts predict that explosive growth in in-building wireless is likely. The infographic shows one prediction for four million distributed antenna system (DAS) nodes to be deployed at one million sites by 2018. DAS are the industry’s most common coverage and capacity solution currently. That’s a lot of growth. Of course, the technological evolution continues onward with new solutions being announced for how best to support in-building wireless in the next 100,000 buildings.
But the general trend towards supporting wireless services in more buildings seems pretty certain. Especially when 2/3 of smartphone users expect websites to load on their devices in four seconds or less (another interesting stat in the infographic). Check out the full “Wrestling with the Data Tsunami Indoors” to learn more. What other drivers do you see pushing this market space forward?


